


How Do You Go From Chaos to a Completely Data-Driven Recruitment Organisation?

Bullhorn partners with many different recruitment technology partners in the EMEA region. In this blog series, we are publishing content written by our partners. In this piece, we have asked René Bolier from OnRecruit to share his insights.
Do you recognise the question listed above? You have a lot of data, you understand you can do something with it, and you would like to. However, in practice and the chaos of the daily grind, that seems to be quite tricky. You dream of an organisation where everyone uses data to generate the maximum positive impact on the business within their roles. Still, in practice, everyone just does their own thing.
First of all, you’re not alone in that. In the past 12 years, I have never found an organisation where the dream mentioned above was a reality. Second, I have encountered many organisations that went from cubbies and complete chaos to being a lot closer to making that dream a reality. And within that process, I have achieved more and more success. So there is still hope!
In this article, I would like to help you get a handle on where you look at how data is used within your organisation. I would also like to help you understand the logical and essential next steps for success. In line with the “better a good copy than a bad original” mentality, I like to use two models from Gartner and Zencos.
Model 1: The “Analytics Spectrum” by Gartner
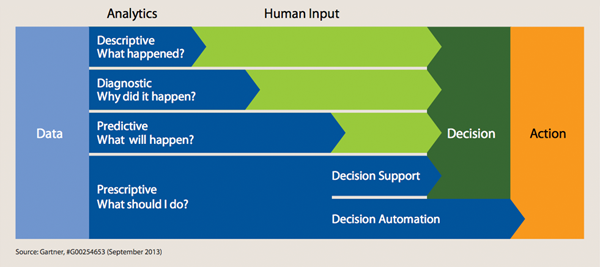
This Gartner model focuses on what the data tells you and how much you must do until you decide. The model has the following four levels:
Level 1: Descriptive (What happened?)
The reporting you see in most recruitment organisations is “descriptive”; it is a report that shows what was done in the past. Think of a report that says: “We had 20m turnover in QQ4; 15% lower than in Q3 and 20% lower than in Q4 a year ago”.
The report does not go beyond that. You look at this report, and you have to do all the legwork yourself; there isn’t much you can do with it. So what happens in the real world? We put the report on the back burner and go back to the daily grind.
Level 2: Diagnostic (Why did it happen?)
In more and more organisations, you can see that reporting is becoming “diagnostic”; the report says what happened and what the drivers were, and why it happened. For instance: “We had 20,000 hours worked in Q4, 10% higher than in Q3. This was due to clients X and Y had 15% more demand, our absenteeism was 30% lower, and our fill-rate was 20% higher.”
As you can see; you start to get more of a handle on your business; you get an idea of why things happen and what influences your success. It becomes a lot easier to understand which dials you can (and cannot) turn to achieve your goals.
Level 3: Predictive (What will happen?)
In some recruitment organisations, great models and dashboards with “predictive” qualities have already been built; they tell you what to expect in the future. For example: “Based on the current influx of new vacancies, the current marketing expenses, the current lead times and conversion rates in our process, the current candidates in the process, we expect 280 placements in the next three months, yielding 4.2m turnover.”
This is great, of course; you don’t have to wait and see what happens, but you can say with a reasonable amount of precision what you can expect for the future and act on it.
Level 4: Prescriptive (What should I do?)
Prescriptive analytics are the holy grail. These help you understand what you need to do today to achieve your goals tomorrow. For example: “for a turnover of 5% in the next quarter, Sales have to get 10% more vacancies within segments D, F, and M, marketing has to spend 50,000 more pounds on channel X, Y, and Z, and recruitment needs to lower the time to fill by one day.”
If every stakeholder knows what they need to do within their role to achieve the business goals and continues to act on that date, you get a culture of “intrapreneurship.” Each colleague becomes an entrepreneur within his or her role, purely working on fulfilling that role, so you get the maximum contribution to what you want to achieve as a team or a company.
It’s even better if the tips are integrated into said colleague’s working environment or if some things get automated.
Model 2: The “Analytics Maturity Model” by Zencos
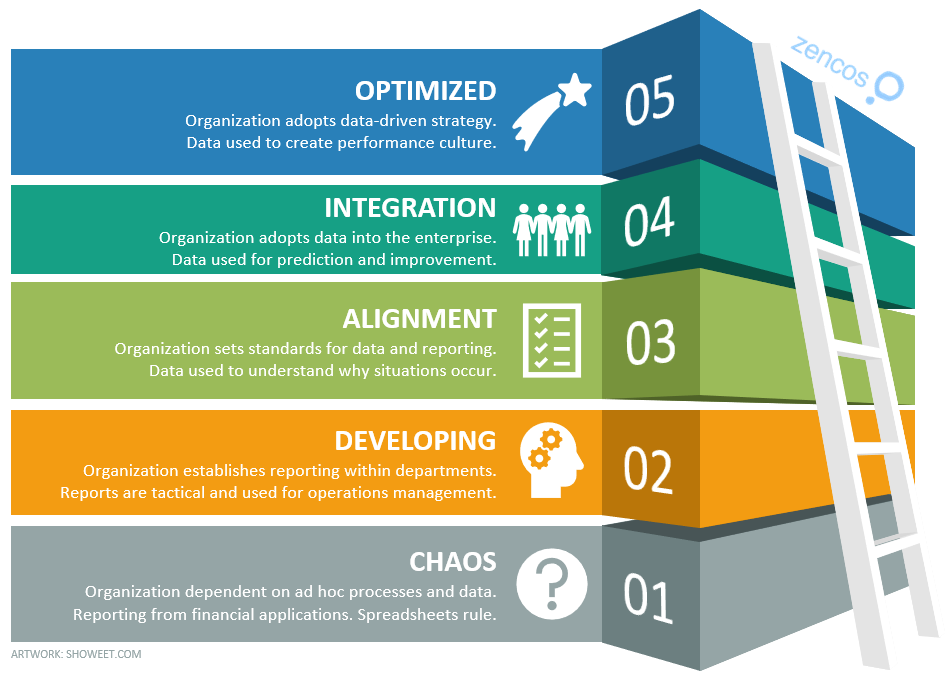
This model primarily looks at how your organisation handles data. It’s vital to understand that when you want to move from one Gartner level to the next, your organisation will have to change a few things; it’s not easy! Which of the following phases is your company currently in?
Phase 1: Chaos
This is the situation where an organisation does not have organised reporting. Reports are continuously produced manually (often in Excel), the quality of the data leaves much to be desired, and the reporting is mainly focused on financial information. The operation has no idea what the drivers for success are or how the organisation can organise itself better and succeed.
Phase 2: Developing
In this phase, understanding starts to permeate through the company about the fact that they need to get started on producing better data. Often in recruitment, you’ll see an upgrade on the tech stack, but also the processes within those tools are meticulously recorded. The issue is, however, that there is still no strategy on actually converting data to better behaviour and there are no stakeholders who take or get responsibility.
Checklist:
❏ Are more and more colleagues at the managerial and operational level understanding that something needs to be done to produce better data?
❏ Do you have a tech stack where all relevant data can be recorded?
❏ Are the processes in your tech stack organised in a way that high-quality data is generated unambiguously?
❏ Who is the “owner” of the above?
Phase 3: Alignment
In this phase, managers and various sections of the business cooperate. They ensure that there is one place where all data is collected (a data warehouse) and that it’s easy for teams (with analysts’ aid) to get insights based on data on which they can subsequently use for decision making. There is more ownership at the managerial level for this subject.
Checklist:
❏ Is it possible to get data out of all of your tools?
❏ Have you organised and combined all your data in one spot?
❏ Do you have internal or external resources that help your teams and stakeholders visualise the data?
❏ Have all of your colleagues found a way to visualise insights that can help them?
Phase 4: Integration
Now we’re starting to get somewhere. All colleagues are beginning to use data for themselves and support their discussions with colleagues, teams, suppliers, and customers. They are continually working on “visual storytelling” and visual insights to become more successful, either individually or as a group. Additionally, teams are set up to start things that the operation itself cannot do, applying machine learning.
Checklist:
❏ How many of your colleagues use visualised data to improve their output?
❏ How many of your colleagues use visualised data to improve cooperation and output with other colleagues, customers, or suppliers?
❏ Are colleagues working on machine learning internally?
Phase 5: Optimised
At this level, every business decision is based on data. At the C-level, a board member is responsible for data and analytics. Using data is no longer a choice or option for colleagues; it has become woven into the entire organization’s DNA. By applying machine learning, the organisation becomes more efficient in converting data into action: Models write precisely what needs to be done to achieve goals (prescriptive analytics).
Checklist:
❏ Who is responsible for data and analytics at the managerial level?
❏ Is every choice and decision in the organisation based on data?
❏ Are the analytics of all teams prescriptive; do they say what needs to be done?
Getting started:
I hope you’ll feel inspired after reading that. I can also imagine that you feel a bit overwhelmed. As such, I would like to help you with the following five tips we often give to organisations to get started:
- Who is the most active with data in the organisation and has analytical and leadership competencies? Make that person the “analytics product owner”.
- Have all teams make a list of the (big and small) decisions made once a week or month.
- Have that product owner use that list to brainstorm with all teams about what “dashboards” would help them.
- Give that product owner responsibility, freedom, and resources to start working on this internal input and the models described above.
- Celebrate success! Getting your organisation to use data as the basis for all their decisions is challenging and a lengthy process, so it’s imperative to keep celebrating achieved milestones and motivate them to plan and accomplish the next.
 About the author: René Bolier has become an expert over the last 12 years in recruitment marketing and technology and loves to help as many people and organisations as possible reach their personal and business goals. Along with being a CEO at OnRecruit, he is active as a speaker and a trainer. He also likes seeing as much of the world as possible, playing poker, good food, and meeting new people. Feel free to connect with him on LinkedIn or email him at rene@onrecruit.net.
About OnRecruit: Recruitment organisations and teams that work with OnRecruit are becoming more and more successful as OnRecruit helps them with combining and visualising all their (marketing, website, ATC, and back-office) data. OnRecruit is a marketplace of Bullhorn. For more info: www.onrecruit.net.


")