


Real-Time Analytics for Growing Recruitment Agencies
")
In this new digital age, data is everywhere. Organisations around the globe are making strides towards digital transformation, and the recruiting industry is no exception. But how can recruitment agencies utilise this wealth of data to best inform their decisions? We heard from Wilson Reed, Product Marketing Manager of Analytics, and Chris Little, Sales & Strategy Specialist, Analytics, to learn how cubeGrowth can help you use analytics to make more informed business decisions, maximise your margins, make placements faster, and improve the value that you’re bringing to your clients.
Read our recap below, or watch the full webinar here.
The challenge
The recruiting industry is undergoing a massive shift toward digitalisation due to increases in technology reliance from an increasingly remote workforce as well as rising expectations from both clients and candidates. Recruitment agencies are grappling with this intense change and need to continue to make smart operational decisions aligned with their organisation’s long-term strategy for growth.
As a result, now more than ever, agencies are turning to their ATS to make smart decisions in this tricky landscape. The recruiting industry is looking for actionable, real-time data to connect their financial decisions to their operations. But while 91% of these agencies are trying to use data to make these critical decisions, about half of these companies don’t trust their data. Additionally, only about 13% of these business are leveraging automation to process their data and make it usable.
Ultimately, businesses want to be data-driven, but there are barriers to success that get in between businesses gathering data and acting on it.
The data path
Becoming data-driven is a journey, and it won’t happen overnight. When we discuss establishing a data-driven culture as the foundation for elite performance, we talk about it in four stages.
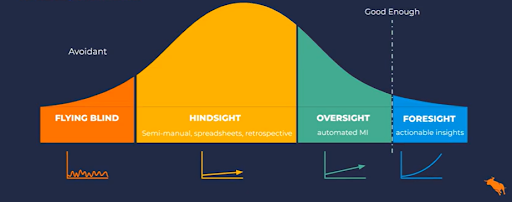
- Flying blind: This first stage is when companies are using data, but not in a uniform way. This might look like individuals using separate spreadsheets with no single source of truth to unify efforts.
- Hindsight: According to a poll at last year’s EngageX event, roughly 75% of all customers place themselves in this stage. Here, companies do have some sort of automation, but there still remains an over-reliance on manually created spreadsheets. Frequently, a single person is responsible for distributing information, but there’s often a significant lag time between when this information is gathered and when it’s distributed. By default, because of this bottleneck, this information is always in retrospect. It also tends to be purely volume-based: “how many of this or that have we done?” The problem with past data is, of course, that you can’t change it.
- Oversight: This is a difficult stage to operate in. Companies in this stage have already invested in analytics tools, but information tends to sit with management. Companies might not have the mechanisms to change or improve performance; instead, they only have visibility into what’s going on. Many organisations see this stage as “good enough.”
- Foresight: Bullhorn Analytics moves organisations to this stage—which is a big leap forward. Organisations in this stage utilise actionable insights to drive their outcomes. In this stage, companies achieve highly scalable growth, leadership has confidence in future sales results, and organisations turn transactional client relationships into long-term relationships with clients.
Bullhorn Analytics makes powerful, easy-to-understand, real-time reporting and actionable insights accessible to users at every level in your recruitment organisation.
Why do top recruitment companies use Bullhorn Analytics?
- Bullhorn adoption
- Desk-level actionable insights
- Client insights and value
- Candidate utilisation and insights
- Pipeline and forecasting
- Data visualisation
What is cubeGrowth?
With Bullhorn Analytics, you can achieve highly scalable growth while positively impacting both the client and candidate experience. Users of Bullhorn Analytics have seen a 39% increase in average billings, a 15% gross margin boost, and a 134% increase in contractor redeployment rate.
This is done through three major pillars: sales clarity, maximised performance, and improved client value.
Sales clarity
Gain clarity of how every team and individual in your business is performing in real-time so you can understand what is likely to happen and what can be done to improve the outcome. Currently, many leaders rely on out-of-date information on subjective views when looking at the results of their business. They need to be able to understand the performance of any office, team, or user in your business in real-time so they can identify trends and answer questions about their business in seconds to immediately identify actions and improve performance.
Maximised performance
Achieve strategic goals faster while reducing burnout and wasted effort by leveraging actionable insights to ensure staff time is spent on the most valuable tasks. By delivering these actionable insights in real-time to every desk, Bullhorn Analytics guides team members on which actions to take and when. This empowers everyone in the business to ensure they are working on the most valuable opportunities, thereby significantly increasing their return on effort while decreasing burnout.
Improved client value
Build long-term relationships with clients while increasing the profit generated from them by automatically identifying revenue opportunities that will improve the value you provide to your clients. Huge amounts of effort go into winning your clients, but often, those relationships don’t develop past the first or second placement. Understanding where time is being invested and using data to educate the client helps turn these transactional sales into long-term relationships. Understanding where you’re successful—and where you’re less so— will improve the confidence your clients have in you.
How can cubeGrowth help my business?
Other platforms were built with analysts and leaders in mind, but Bullhorn Analytics was designed from the ground up, focusing first on the desk level, so everyone is empowered to achieve business objectives. The self-service reporting of Bullhorn Analytics breaks down barriers to success by neutralizing the lag between needing data and acting on it. Ultimately, this helps drive Bullhorn adoption because these actionable insights show users how adding data to Bullhorn will help them achieve their goals. The better the data, the better insights for the end-user.
Bullhorn Analytics has incorporated the 40 most important business metrics—for example, leads, opportunities, CVs, client submissions, interviews, placements, and revenue—right into the cubeGrowth solution. You can also click into any piece of data and view a summary of the granular data driving that high-level number.
Here, you can also start to drive Bullhorn adoption. You can identify where key information has been missed in the workflow, and Bullhorn Analytics has even incorporated data quality metrics right into the cubeGrowth solution, so you can monitor your data health.
You can also set any metric in cubeGrowth against any other metric in the form of a ratio to help set meaningful targets for your team moving forward.
From a higher-level perspective, you can also look at the metrics of a particular office or even an individual team within an office. This overview provides a perspective from a leadership point of view of where your team needs help and affects change in the present rather than looking back.
When it comes to clients, you can also take a look at data for individual clients. After all, the best way to improve client value is to fully understand your clients. Where is your success? How can you provide them with the best value? These client dashboards are fundamental to building a better client understanding.
We’ve been talking about growth—but what does growth mean to you? Opening into a new office or a new sector? Improving gross profit per head? With our Onpoint function, you can monitor any of your teams and individuals over any of these metrics and start leveraging information so you know what success looks like for each person, your team, and your organisation.
With cubeGrowth, your team has the ability to not only manage their own performance but maximise it. cubeGrowth shows volume-based metrics for each person, as well as insights on where your team members can improve. These actionable insights come from data analysis, guiding your team towards what they can do today to be more successful tomorrow.
Plus, in Bullhorn Analytics’s Jobs Pipeline, you can also visualise all of your jobs currently run by the whole company. You can utilise filters to see a snapshot of any of your jobs at what stage they’re at. But this also goes deeper than high-level numbers: when you click on a job, Bullhorn Analytics also provides the context around any job to know what you need to do in a job’s workflow and when.
With Bullhorn Analytics, gain clarity into your sales, maximise performance, and turn volume-based metrics into actionable insights. With real-time data at your fingertips, you can increase your revenue while improving your client relationships and achieve highly scalable growth.
To learn more about cubeGrowth, visit bullhorn.com/products/bullhorn-analytics or reach out to your account rep.